

How to Set Goals for Trade Shows
We get this question all the time. It’s one we love to answer because it’s so important for ROI and executive buy-in. Here’s a quick overview of the four ways to set goals for trade shows:
- Top-of-Funnel Method based on a series of calculations starting with total attendees and taking expected percentages until you arrive at a reasonable goal
- Reverse Revenue Method based on break-even relative to investment using standard conversion rate and average order size
- Sales Coverage Method based on a multiple applied to the number of sales professionals, days and hours
- Visitor Tracking Method based on a combination of sensor and lead capture technologies
Driving ROI Starts with Setting Goals for Trade Shows
Setting specific lead generation goals for trade shows feels like a difficult guessing game. In fact, many companies hesitate to quantify their lead gen goals. Instead, they may default to “Return on Objectives” metrics like the total number of attendees at the conference, speaking sessions, brand presence or changes in website traffic.
Those are certainly important considerations, but they don’t equate to the main driver of trade show investment. According to the International Association of Exhibitions & Events (IAEE) President and CEO David DuBois, most CEOs and CMOs (93 percent) agree that lead generation is the number one reason they invest in a trade show program. The good news is there are a number of easy ways to set goals for trade shows.
Top-of-Funnel Method
The Top-of-Funnel Method uses a series of calculations based on expected percentages. These reflect reasonable expectations of qualification, engagement and conversion starting with the universe of possible leads, or all trade show attendees, to set goals.
Here are the percentages we use:
- 60% of the total to remove exhibitors, staff, guests, etc. and reveal Net Targeted Audience (NTA)
- 60% of NTA gives you your Net Marketing Qualified Leads (NMQL)
- 40% of NQL estimates likely Booth Traffic
- 35% of MQL Booth Traffic estimates the number of Sales Qualified Leads (SQL) you can expect from an engaged sales team in the booth
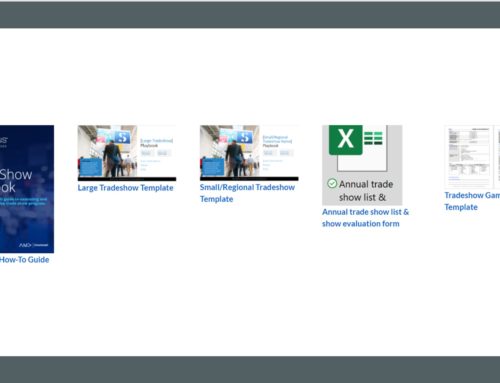
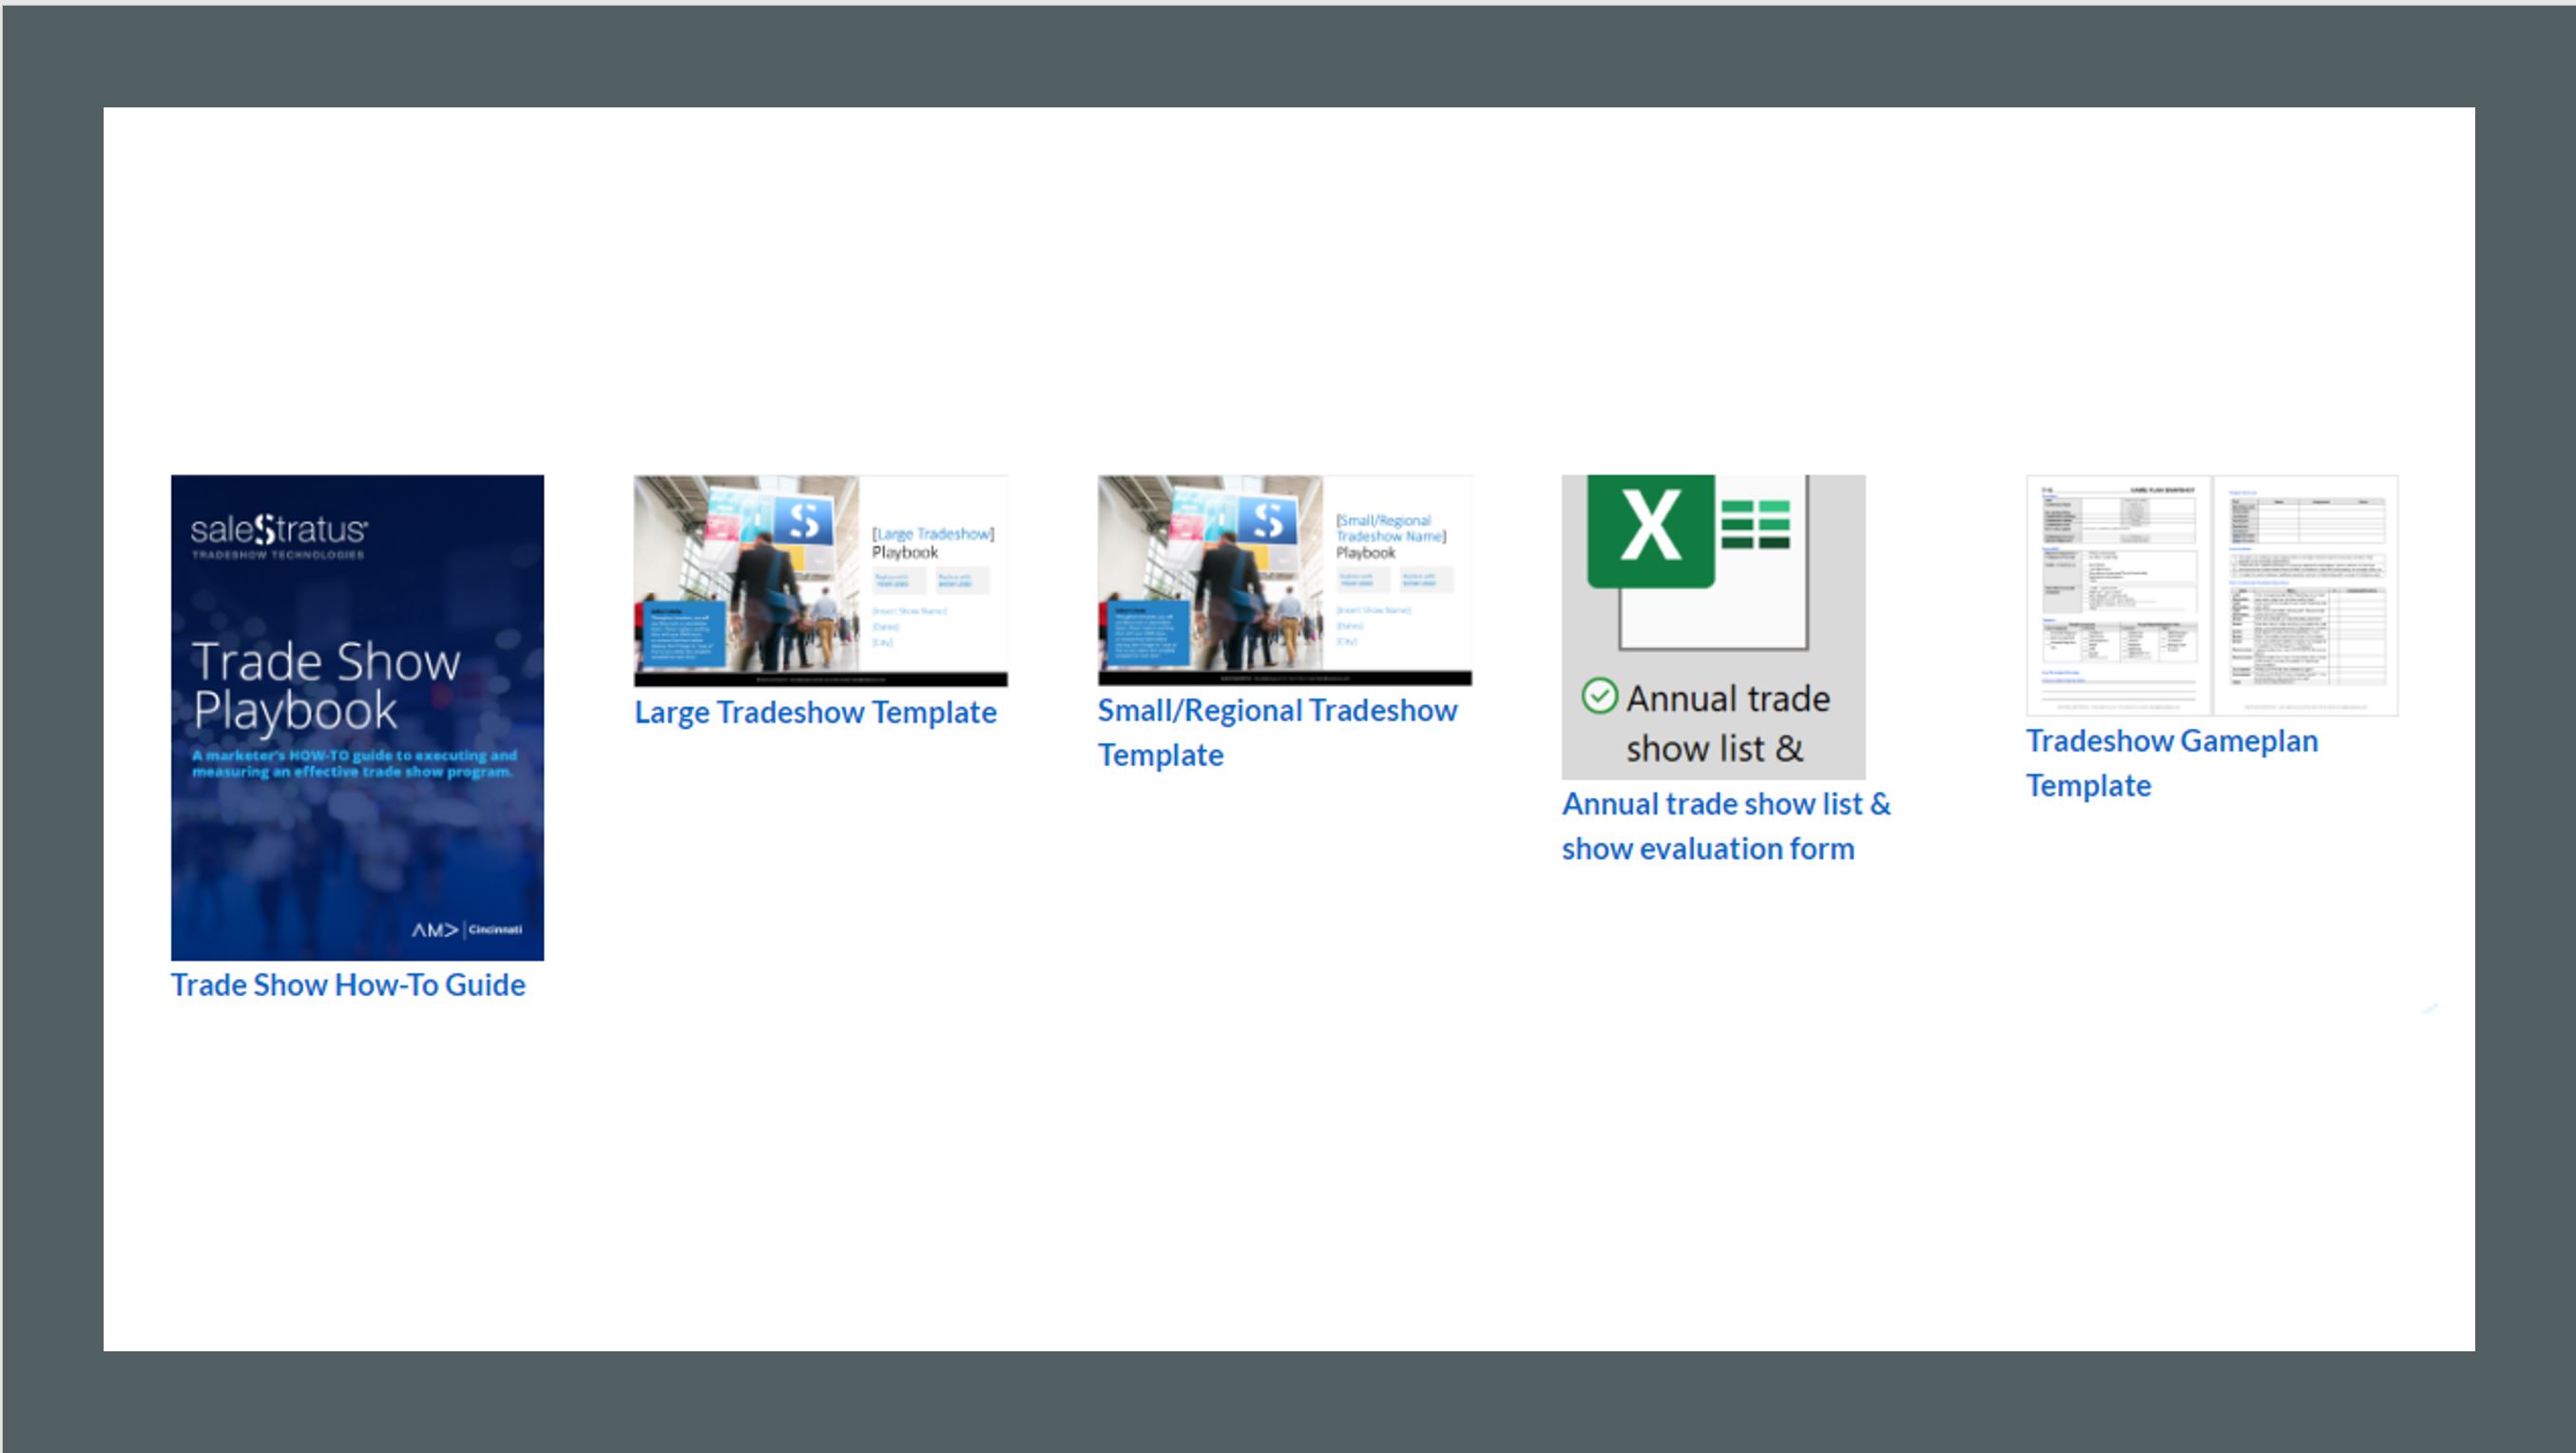
If you prefer to start with a short cut, the above equates to about 5% of total attendees. The percentages we use are based on extensive experience across shows and industries, but your experience may be different. You should conduct your own analysis to test the numbers in your own data. You can find a comprehensive example and template in our Trade Show Toolkit – request that here.
Reverse Revenue Method
Next is the Reverse Revenue Method. This approach backs into the number by looking at the investment you’re making in the show and applying a multiplying factor. This is pretty straightforward, but there are still a few steps involved.
Start with the amount you’re investing in the show. What would make that investment worthwhile? How much revenue based on size and/or the number of sales would you need to bring in to break even? How much would make it a win? This gives you a SALES number to shoot for. But that doesn’t equate to the number of leads you need yet unless you are the unicorn with a 100% conversion rate!
So now you need to determine your average conversion rate of Sales from Marketing Qualified Leads (MQLs) in your pipeline, as well as the average order size. This tells you how many leads are needed at your conversion rate to hit the sales number you’ve specified.
Here’s an example. Let’s say the cost of the show is 25,000. But you don’t want to just break even. Apply a 4X success factor. So the revenue goal is $100,000. If the average deal size in the company is $5000, then 20 new customers are required to achieve the goal. If the conversion rate in the CRM from top of funnel to purchasing customer is 20% that means that 100 qualified leads from the show would be required in order to meet that goal.
Sales Coverage Method
This approach is much more rudimentary than the first two. It consists of multiplying a standard number of 20 leads per day by the number salespeople you have at the booth. That’s because 20 is the number we believe you can safely anticipate an engaged sales professional to pull in per day at an “average” trade show.
This may be good enough for a highly targeted show that has decent traffic. If booth hours are limited you might need to adjust the number. But remember, there really is no such thing as an “average” trade show. With multiple variables from show size, to the number of exhibitors, size of booth and attendee focus, there can be a lot of variation in the real right multiplier for you.
Visitor Tracking Method
The Visitor Tracking Method is really a hybrid and works best when you have a larger, multi-show program. It depends on the results of one show to inform the goals of another. Set your goals for the first show based upon one or more of the first three methods described above.
This is where it gets really fun. To set goals for future shows, you can use lead capture and visitor tracking technology together at the first event to show an actual lead conversion rate (versus a sales conversion rate described above) based on tracked booth traffic and real-time captured leads.
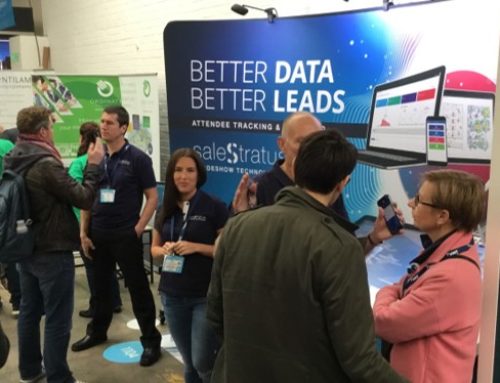
For visitor tracking, we use Wifi Sensors we place at the booth. For lead capture, we use the SPARK App, collecting attendee contact information via badge or card scanning and adding lead qualification information using custom questions in the app.
To help set goals for future trade shows, divide the number of leads captured by the total number of engaged visitors (those who enter and linger) at the booth to give the conversion rate, which can be broken down by time, salesperson and/or area of the booth. Best practice use cases show that companies engaging in goal setting, booth staff training, pre-show campaigning, and employing the latest lead capture technology achieve conversion rates of over 30% of engaged attendees at the booth into leads. Companies choosing not to engage in these techniques see conversion rates less than 10%.
As a bonus, sales pros are competitive! When we share the level of detail we can capture and train the sales team on how to best engage and capture leads, it’s game on. This provides them with a healthy level of competitive pressure to engage with customers at the booth and creates an excellent baseline for evaluation and goal setting for the following year.
Getting Started with Setting Goals for Trade Shows
Don’t overthink it. Pick the method above that makes the most sense to you given the information you have, and see how it goes. The key is to set a goal regardless of the method. This drives much better behavior and accountability with the sales team and booth staff. Once you’ve set the goals, be sure you have a plan for how to qualify leads in the booth so you can compare your plan to actuals. Even if your goals are off compared to your actual experience, you’ll learn something that helps you refine your process for next time. You’ll start to build your ROI story in a way that the C-Suite will notice, appreciate, and maybe even reward.
Join the conversation on LinkedIn, and contact us any time to let us know what you think, make suggestions, or request more info!
