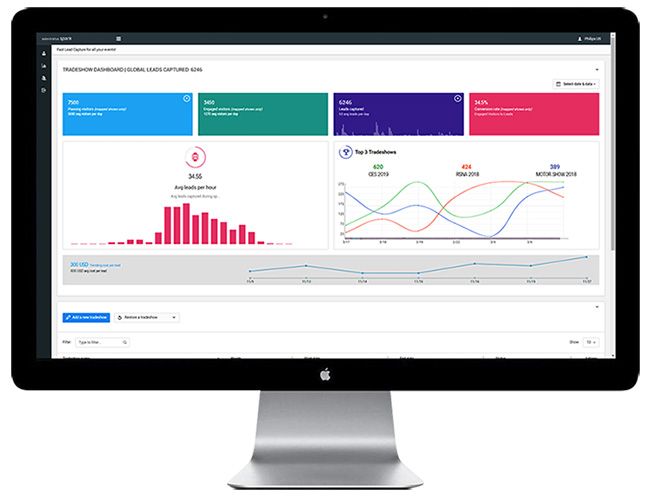
Engagement Analytics
Tradeshow Investments & ROI: Not a Guessing Game
A tradeshow engagement analytics dashboard is not a pipe dream. Finally, you really can measure it! Between the expertise of our team, our integration partners, and the Sale$tratus® SPARK App, the insights are at your service.

Track Key Metrics and Gain Valuable Insights Across Shows and Sales Pros
Our Engagement Analytics Dashboard provides a real-time and over-time snapshot of progress. So whether by individual, booth location, virtual experience or live trade show, you are now able to see results clearly. More than that, your results are easy to share with others. As a result, when it’s time to make your case for future investment, you no longer need to depend on gut feelings. Furthermore, exhibitors have a tangible tool to help them know what’s working and focus activity. So you can identify high-performing sales professionals to model for others. And you can partner with show organizers for better booth location and set up next time.
Measure and Track More than Ever Before
The Sale$tratus® SPARK App includes an analytics dashboard that provides valuable real-time data, including metrics like:
- Captured leads
- Leads per hour
- Scans per person working the booth
- Individual team member scan count
- Conversion Rates
A simple addition can add a whole new layer of insight. This technology uses EX-Sensors and heat mapping, thus providing counts of traffic in and around the booth. With this addition, you can also see KPIs like:
- Total attendees who pass by the booth
- Engaged attendees, based on booth entry
- Which areas of the booth are working and which are not
- Attendees’ movements within the booth
- Average time spent in the booth
Even in the virtual world, we are able to track attendee behavior and incorporate it into our analyses to evaluate performance and inform future decisions. The digital counterpart to the physical tracking includes:
- Hotspots
- Codes embedded in links
- Link mapping
- Conversion forms

Report the Big Picture: Compare Shows or Show Cumulative Impact
Real-time data for one show is a dramatic improvement. We go one step further to show you your data across multiple shows. As a result, you are able to show the ROI of a given tradeshow, and also the overall ROI for your tradeshow initiatives. Our clear, simple graphics make it easy for you to share the results with executives, colleagues, and partners. Even easier, you can download or email lead data instantly from your phone for fast follow-up if the service is activated. And we have added a custom report feature option to help you build your ideal CSV file.


